Unified Inventory
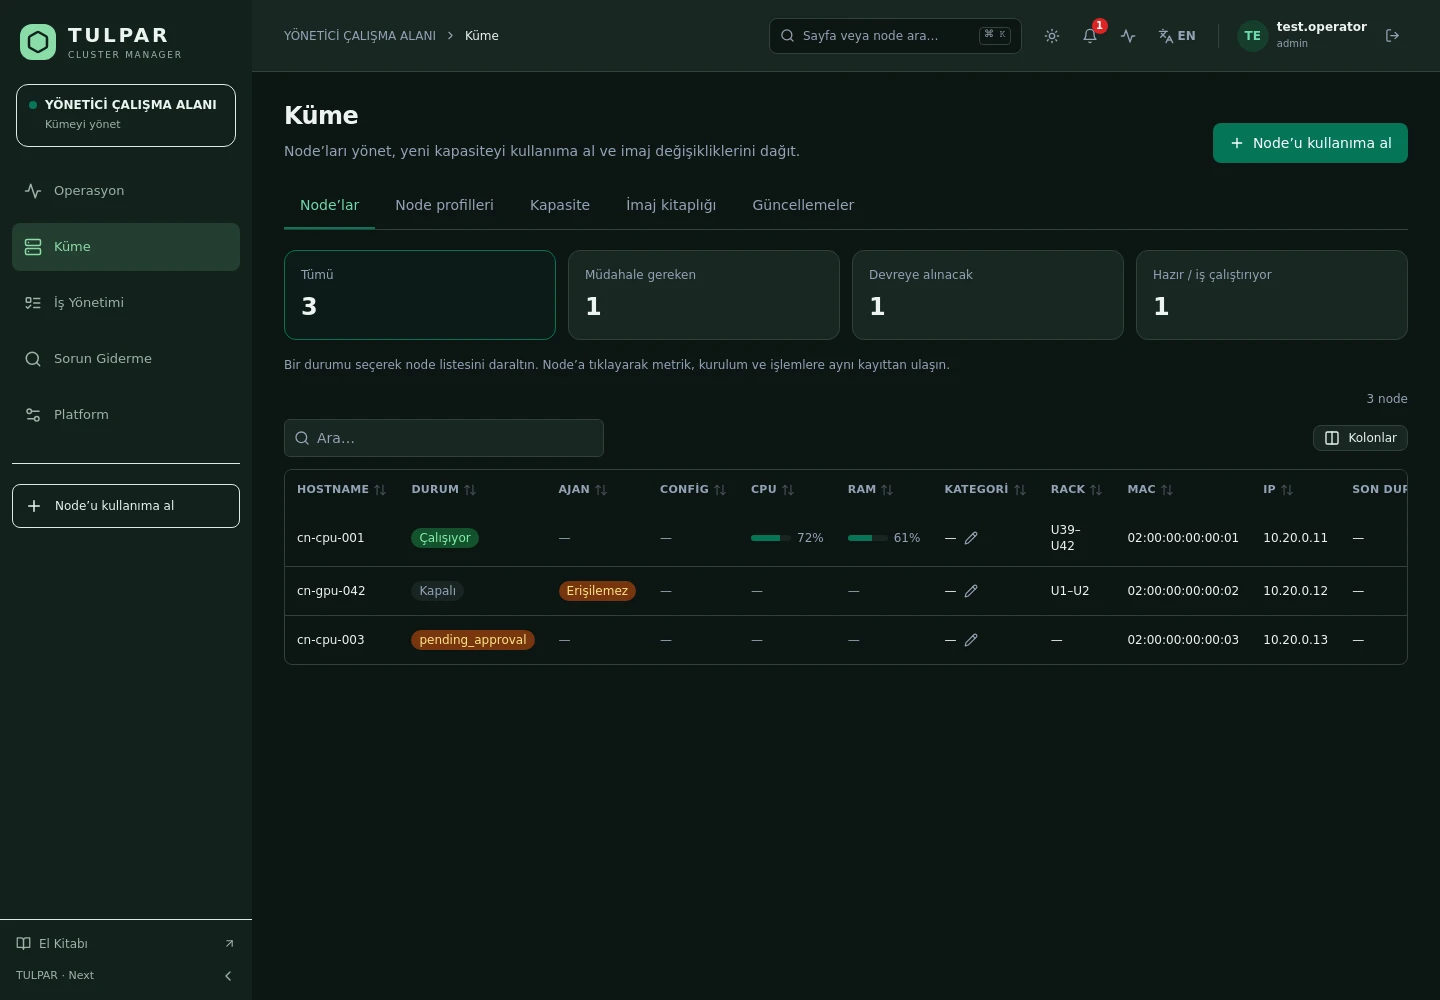
Every node in one list: state, inline CPU/RAM summary, and a tabbed detail view.
 CLUSTER MANAGER
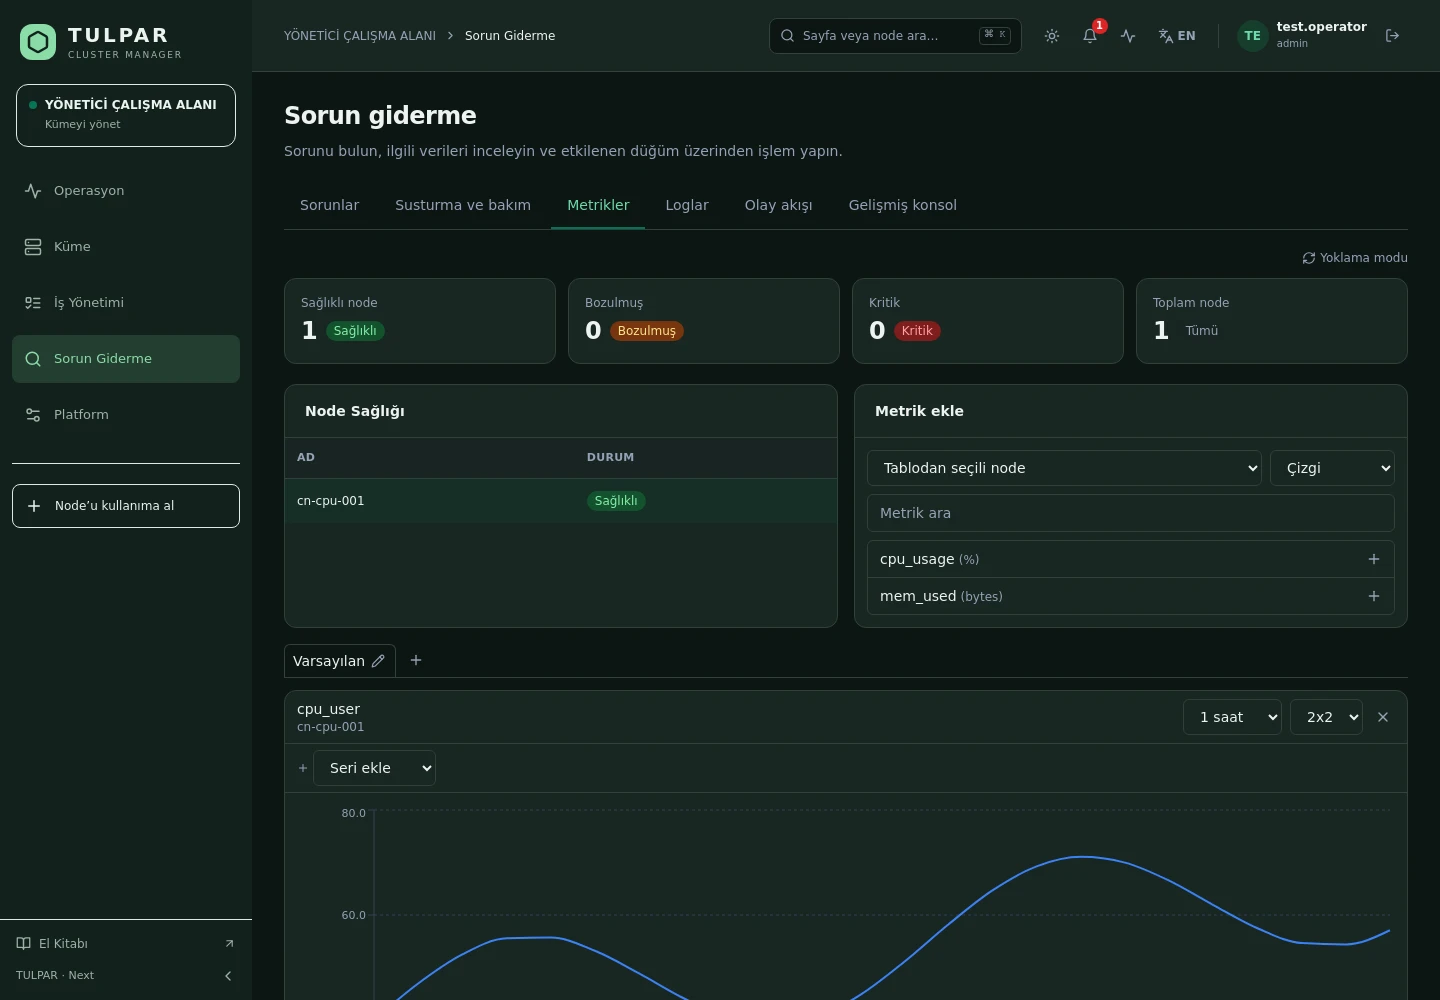
Node Monitoring
Instead of hopping between nodes over SSH, see the real state of your cluster instantly with Prometheus-based metrics, health checks and alerts.
Node agents stream metrics into Prometheus — scales naturally to 100+ nodes.
Charts, alerts and logs inside the panel — without installing and maintaining Grafana.
What's Inside
From inventory to GPUs, from health checks to central logging — the whole monitoring stack ships with the installation.
Every node in one list: state, inline CPU/RAM summary, and a tabbed detail view.
CPU, RAM, disk, network and InfiniBand time series — per node and cluster-wide.
NVIDIA GPU inventory, utilization and temperature metrics via DCGM.
Service and node health probes, recorded automatically on the unified event timeline.
Threshold-based rules; SMTP, webhook and in-panel notifications; silences and maintenance windows.
Node logs stream to the head over RELP+mTLS; search from the panel with LogsQL — 90-day retention.
TULPAR / Node Monitoring
Watching isn't enough — TULPAR lets you act on what you see, from the same screen.
GOOD TO KNOW
Got questions? Everything you need to know about installation, licensing and scaling is here.
tulpar-preflight.sh prepares the prerequisites, install.sh brings up the whole stack; you then enter the admin password, NTP, LDAP and SLURM settings in the web wizard. A typical installation completes in minutes.docker load. Every component works on a closed network, including node installation, monitoring and central logging.READY FOR YOUR NEXT COMPUTATION
Let’s explore what TULPAR can do for your cluster.
Request a demo