Features

End-to-End Cluster Management

From the Slurm job queue to Warewulf provisioning, from infrastructure services to observability — install, monitor and manage every layer of your cluster from one powerful panel.

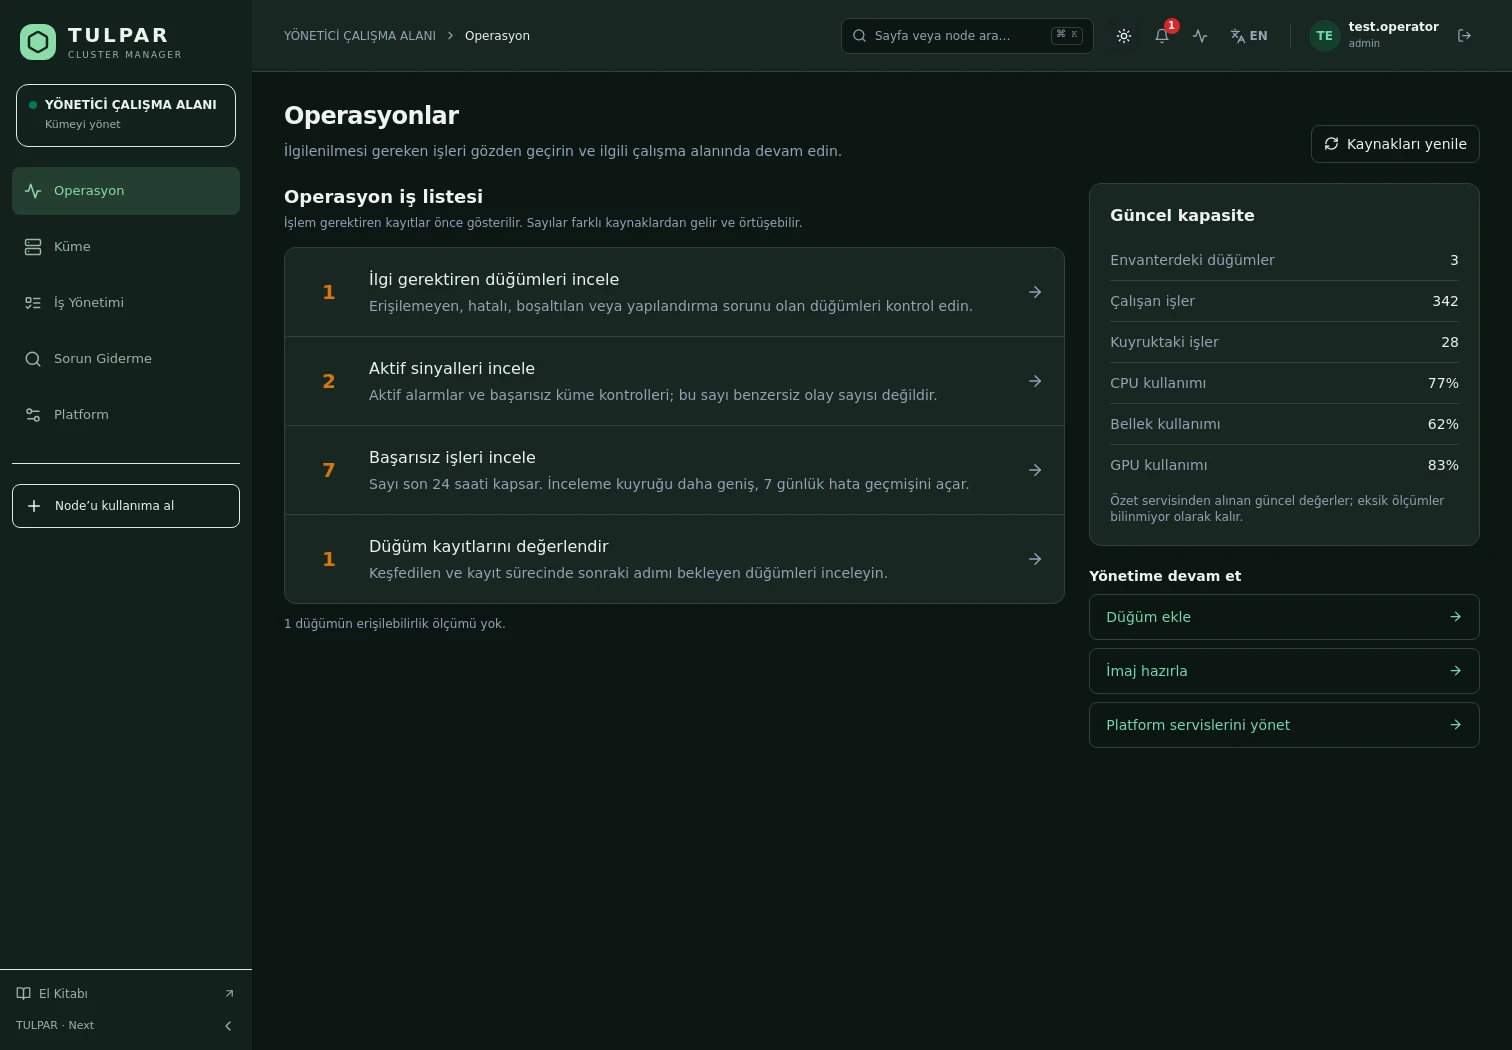
Unified inventory and a single panel

Node states, CPU/RAM/GPU metrics, the job queue and service health — all on one screen, no SSH required.

Role-based access control (RBAC)

A four-tier permission model from Super Admin to researcher; team leads see only their own team's jobs.

Observability

Data-Driven Cluster Management

Instead of hopping between nodes over SSH, see the real state of your cluster on one screen with Prometheus-based metrics and a unified event stream.

  • Real-time metrics

    CPU, RAM, disk, GPU and InfiniBand metrics are collected automatically from every node; in the job detail view, Slurm accounting data joins Prometheus series.

  • Alerting and event management

    Rule-based alerts arrive via SMTP, webhook or in-panel notifications; silence windows and an ack flow keep alert fatigue away.

For Researchers

Submitting Jobs Has Never Been Easier

Instead of wrestling with sbatch scripts, researchers submit jobs from a web form, watch the queue and track their own resource usage.

  • Parameterized job templates

    Turn frequent jobs into templates and share them with the team — users submit correctly configured jobs in seconds by filling in a few parameters.

  • Per-user permissions and attribution

    Every job is submitted under the signed-in user's identity; fairshare, accounting and RBAC scoping — team leads see only their own team's jobs.

Enterprise Resilience

Runs Smoothly Even Air-Gapped

  • Offline environment support

    Local RPM repositories, GPG-signed offline bundles and in-panel package import — complete installation and updates even on closed networks.

  • Security and auditability

    Every mutation lands in the audit log automatically, with SHA-256 hash-chain tamper detection; nightly backups and config bundle export/import are standard.

Full Capabilities

Every Layer of the Cluster, Under One Roof

From job scheduling to hardware control, from provisioning to auditing — TULPAR's capability set covers the entire lifecycle of an HPC cluster.

Unified Cluster Dashboard
  • Cluster health, workload and resource status on one screen
  • Real-time, self-refreshing dashboards over WebSocket
  • Node state distribution and live time series
  • Quick-access cards for frequent operations

Details
Slurm Job Management
  • Submit, track, cancel/hold/release jobs — no CLI required
  • Accurate fairshare and accounting with per-user attribution
  • Partition, reservation, QOS and association management
  • Self-service submission with parameterized job templates
Details
PXE Provisioning & Image Management
  • Node discovery and approval queue on Warewulf 4
  • Automated OS installation with disk-install kickstart
  • Image factory and versioned image deployment
  • Node configurations converge declaratively via the agent
Details
Infrastructure Service Management
  • Install and manage NTP, LDAP, DNS and MySQL from the panel
  • Config editors and one-click deploy
  • Service health status and connection tests
  • Live deployment logs
Details
Identity & Access (RBAC)
  • Hybrid local + LDAP/SSSD authentication
  • Four-tier role model with scope-based permissions
  • Team leads see only their own team's jobs
  • JWT-secured sessions with automatic renewal
Details
Real-Time Monitoring
  • Prometheus-based CPU/RAM/disk/GPU/InfiniBand metrics
  • SSH-free collection — scales naturally to 100+ nodes
  • Slurm accounting joined with Prometheus in job details
  • Central log store with in-panel log search
Details
Alerting & Event Management
  • Rule-based alerts: firing → notification → ack flow
  • SMTP, webhook and in-panel notification channels
  • Time-boxed silences and maintenance windows
  • Unified event timeline
Details
Docker Pod Management
  • Container lifecycle: start, stop, restart
  • Live log streaming with xterm.js
  • Instant container metrics over WebSocket
  • Compose viewer
Details
Automation Engine
  • Metric threshold or health event → drain/reboot/power/notify
  • Dry-run mode for side-effect-free trials
  • Detailed execution trace for every run
  • Self-healing configuration drift
Details
Security & Audit
  • Automatic audit logging for every mutation
  • One-click tamper verification with SHA-256 hash chain
  • Rate limiting, security headers and hardening
  • Single-source secrets with rotation procedures
Details
Backup & Continuity
  • Automatic nightly backups: databases + Slurm state
  • Config bundle export/import — with mandatory dry-run report
  • Night watchman: drift, surface and backup freshness checks
  • One-click vendor support bundle
Details
Hardware & Network Management
  • Power control via BMC and SOL console access
  • Network/IPAM: subnet definitions and automatic IP allocation
  • GPU inventory and DCGM metrics
  • Topology view and NFS storage management
Details

Frequently Asked Questions

Got questions? Everything you need to know about installation, licensing and scaling is here.

TULPAR is an enterprise product offered under a commercial license. Licensing is annual, based on your cluster scale and the support coverage you need; every license includes the full feature set — there is no feature gating. Contact us through the contact page for a quote.

An EL9-based head server is enough. tulpar-preflight.sh prepares the prerequisites, install.sh brings up the whole stack; you then enter the admin password, NTP, LDAP and SLURM settings in the web wizard. A typical installation completes in minutes.

TULPAR talks to Slurm over the slurmrestd REST API and falls back to the CLI automatically, providing a stable, version-independent interface. Head Slurm components run natively on the host (dnf/systemd) and share the same repository and version as the compute nodes.

Yes. RPM repositories travel with the product, the Slurm package repository can be imported as a GPG-signed offline bundle, and container images are loaded with docker load. Every component works on a closed network, including node installation, monitoring and central logging.

%