Cluster Status
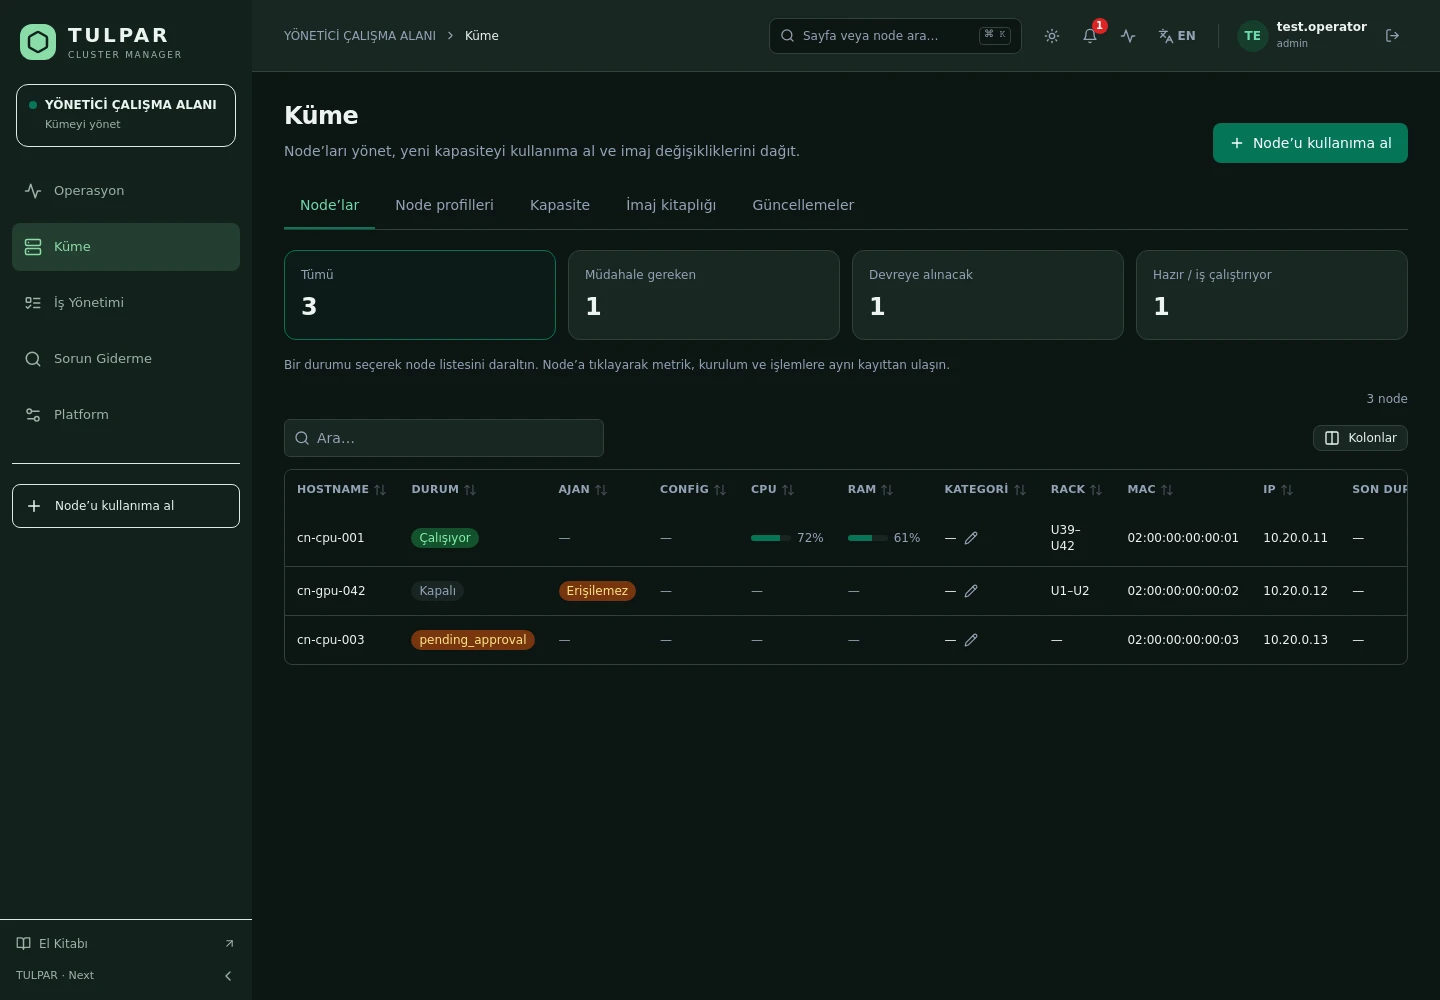
Node status distribution — ready, installing, down and needs-attention — summarized in one chart.
 CLUSTER MANAGER
Unified Cluster Dashboard
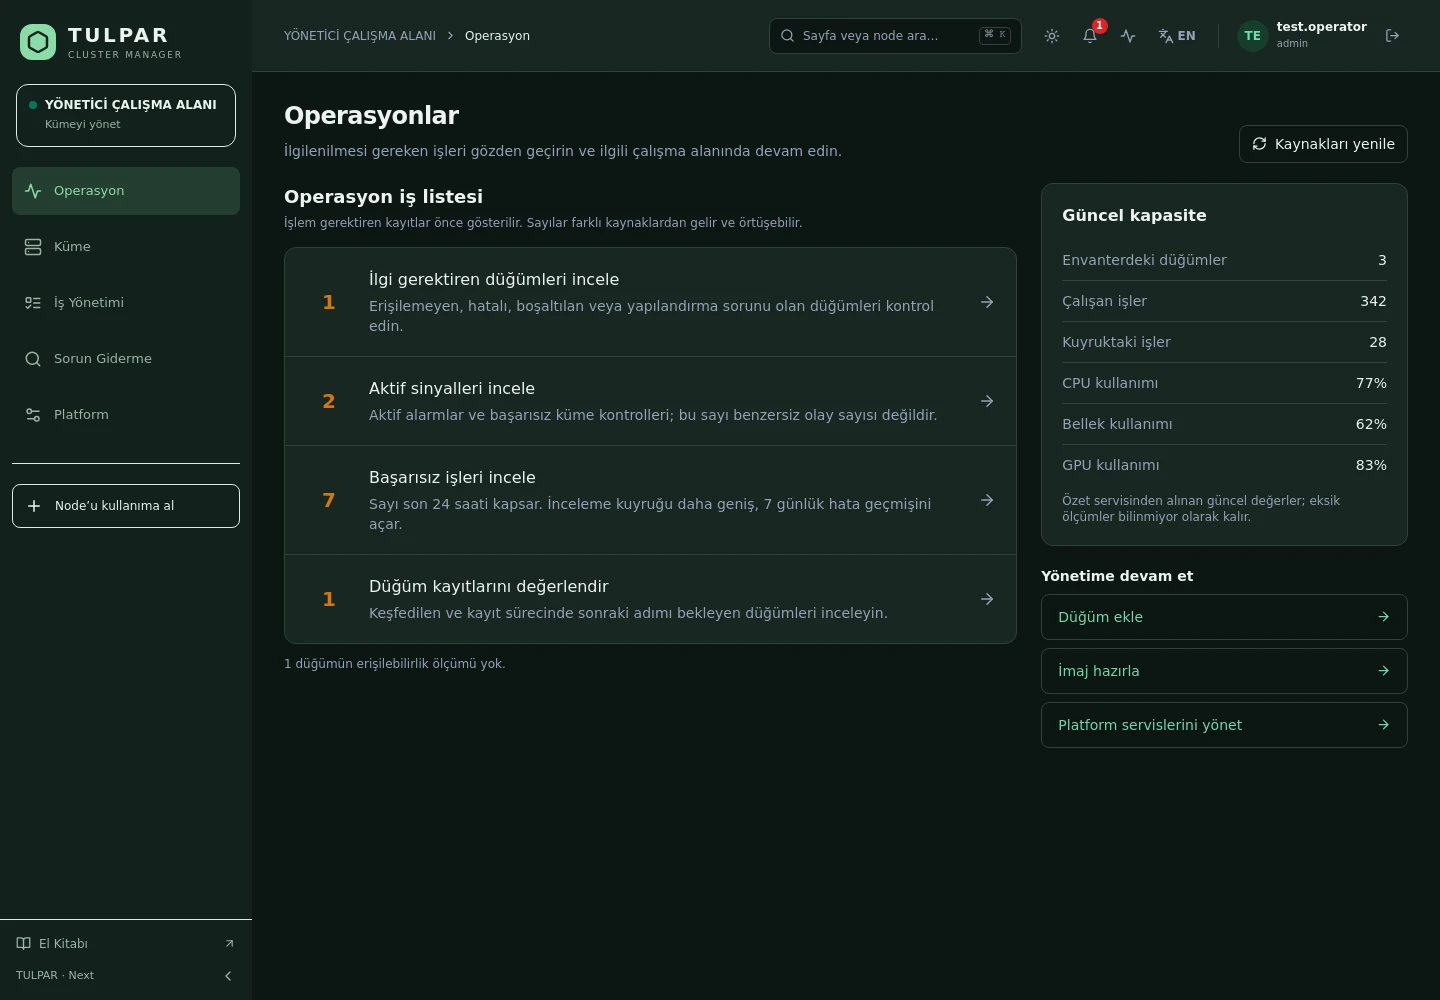
Node health, workload, resource consumption and open alerts converge on a single board — it refreshes itself over WebSocket, so you never have to go looking for a problem.
Metrics and states stream in live; no page reloads, no stale numbers.
Nodes with failing health checks and firing alerts are collected at the top of the board.
What's Inside
The dashboard doesn't just summarize — every card is a door into the management screen behind it.
Node status distribution — ready, installing, down and needs-attention — summarized in one chart.
CPU, memory and load curves; pick a node to drill into a single machine's resource profile.
Running, pending and completed job counts read live from Slurm.
Firing alerts and failing health checks are listed with a link straight to the node concerned.
One-click cards into inventory, provisioning, monitoring, Slurm and alerting.
RBAC scope applies to the dashboard too — everyone sees only the data they are entitled to.
TULPAR / Unified Cluster Dashboard
Every number on the board has a known origin; this is a mirror of the live system, not a showcase.
GOOD TO KNOW
Got questions? Everything you need to know about installation, licensing and scaling is here.
tulpar-preflight.sh prepares the prerequisites, install.sh brings up the whole stack; you then enter the admin password, NTP, LDAP and SLURM settings in the web wizard. A typical installation completes in minutes.docker load. Every component works on a closed network, including node installation, monitoring and central logging.READY FOR YOUR NEXT COMPUTATION
Let’s explore what TULPAR can do for your cluster.
Request a demo